0.700
That number, 0.700, is the combined FTA/FGA ratio of Dwight Howard, Derrick Rose, Kevin Durant, Chris Paul, Dirk Nowitzki, LeBron James and Kobe Bryant after the first weekend of the NBA playoffs. It’s also patently absurd. It means for every 10 shots that septet attempted, they also attempted 7 free throws. Just for comparison, the FTA/FGA ratio across the entire league this season was 0.300. Those seven players had a combined FTA/FGA ratio of 0.448 during the regular season.
Let me point out that I’m talking about the ratio of free throw attempts to field goal attempts. Sites like Basketball-Reference, usually display a ratio of free throws made to field goal attempts. I’m primarily concerned here with the rate at which fouls are being called, so whether the free throw is made or missed is largely irrelevant for this discussion.
After the first game in each series, we have a FTA/FGA ratio of 0.368 for the playoffs, a significant increase over the 0.300 league-wide mark for the regular season. In recent history, this pattern has been common. The table below shows the FTA/FGA ratio for each of the past five seasons, comparing the regular season to the playoffs.
Other than 2007, we see that pattern of fairly significant increase in FTA/FGA from the regular season to the playoffs. This seems to fit well with the common wisdom, play is more physical in the playoffs, hence more fouls are called. Brief Digression: This pattern would also seem to fit with the idea that stars receive more calls in the playoffs. Which of course, runs counter to the perception that referees swallow their whistles in the postseason and let the players play. I can’t tell you how much I enjoy when several stereotypes are held without question, despite them being in complete opposition to each other.
Given the ridiculous free throw numbers posted by that handful of players this weekend, it stands to reason that some of that difference between regular season and playoffs could be attributed to just a few souls. In trying to identify similar players for comparison, I noticed that the seven players I mentioned above could all be considered top candidates for Most Valuable Player. MVP candidates work well as a data set for this analysis because they generally post very high usage rates, and therefore would be taking a high number of both shots and free throws. Also, if we are going to talk about the idea that stars are given preferrential treatment, no one would seem to pull more gravity from their reputation than an MVP candidate from that season.
This next table shows the same information as above, except I removed from my calculations the free throw attempts and field goal attempts of the top seven MVP candidates for each season, from both the regular season and playoff figures. Essentially, this table just shows us the numbers for everyone besides those seven stars.
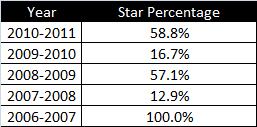
Except for 2007, we still see an increase from the regular season to the playoffs but it’s much less drastic without those seven stars included. In fact, in three of those seasons, the seven players I removed accounted for a tremendous portion of the overall difference. This last table shows the percentage of the difference between regular season and playoffs which can be traced to the performance of those seven players which were removed.
There are obviously great fluctuations from season to season. Part of that has to do with how deep each of the MVP candidates went in the playoffs. If a player participated in 5 playoff games his FTA/FGA ratio will have much less influence on these overall numbers than if they had played 25 games. If I went through each season subjectively selecting the “biggest stars” who’s teams went furthest in the playoffs, I’m sure I could come close to duplicating those 50% figures for every season.
Most of you probably won’t be reading this post until sometime on Tuesday. Statistics from Monday night’s games could change these numbers, but I would guess not enough to dilute my point. The bottom line here seems to be that stars get more calls in the playoffs, but we already knew that. This is attributable to a multitude of reasons, although probably not a malicious and diabolical system of collusion between the league and it’s officials. What seems especially striking here is how stars getting more calls in the playoffs diguises the real foul rate of everyone else. It’s true that there are more fouls called in the playoffs. However, it’s more true for some players than for others. One widely accepted truism obscures the real facts behind another.


Pingback: Just Giving it Away » Stathead » Blog Archive
Pingback: Wednesday Bullets: Celtics überstehen Melo-Show, Magic gleichen aus und Dirk mit dem 2:0 | FIVE Basketball-Magazin - NBA Blog
interesting. makes sense though, drawing fouls is generally more physically exerting than other scoring methods. and efficient players tend to be able to force fouls more often, as well as drawing more attention. it’s possible that the fouls/noncalls ratio is lower in the playoffs due to the player’s trying harder, making the perception less wrong considering that it’s based on the eyetest. don’t really have any data on that though
still, the difference is pretty remarkable; particularly through this years playoffs, i think a few situational things have certainly skewed the data in this direction a little bit more than normal this yr. the hawk’s decision to guard howard 1on1 particularly
anyway good stuff
should update this to reflect the first round action too man