Category Archives: Chicago Bulls

Crying Foul

After the first weekend of the playoffs, I wrote a post about the astonishing 0.700 combined FTA/FGA ratio posted by Kevin Durant, Kobe Bryant, LeBron James, Derrick Rose, Chris Paul, Dirk Nowitzki and Dwight Howard. Not surprisingly, that number has come down over the past week. However, it hasn’t dropped as much as you’d expect. After four (or five) playoff games, that septet’s FTA/FGA ratio has fallen to 0.635.

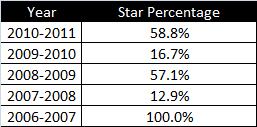
In general, more fouls are called in the playoffs, which means more free throw attempts, which means that ratio will rise league-wide. In last week’s post we found that star players tend to create a much greater share of that change then your average player. This year we found that the FTA/FGA ratio had risen 0.068, from 0.300 in the regular season, 0.368 in the playoffs. We also found that if we removed the field goal and free throw attempts of those seven players, the increase was only 0.028, meaning this group was responsible for 58.8% of the increase.

A comment on that first post asked me to provide updated numbers to see if the pattern is holding steady. It certainly is. This table shows the FTA/FGA change from the regular season to the playoffs in each of the last 5 years.

This table shows the same numbers but with the seven top MVP vote getters removed. (For this season, it’s the Durant, Kobe, LeBron, Rose, Paul, Nowitzki, Howard group we already identified.)

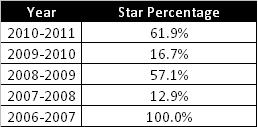
This table shows the percentage of the change which can be traced to the contributions of those seven players we removed.

Although the league-wide gap between the FTA/FGA ratio in the regular season and playoffs has narrowed, our seven stars are actual responsible for a great share of the change than they were just a week ago.

It’s very probable that this pattern won’t hold past the first round, mostly because of the way I’ve calculated it. I’m removing the total contributions of those seven players from the total numbers, league-wide. Either Kobe or Paul will be eliminated, possibly with Dwight Howard joining them. As those players check out of the playoffs the league-wide totals will continue to grow without their contributions. Part of the reason the percentages were so low in 2010 and 2008 is because several of the MVP candidates were knocked out of the playoffs early on. My guess is that if the numbers were run on a round-by-round basis we would see consistent percentages closer to the 50% range.

There are plenty of possible reasons for this pattern, some reasonable, some slightly disconcerting. Whatever the reason, there can be no question that stars get more calls in the playoffs than their less-accomplished counterparts.

1 Comment

Filed under Chicago Bulls, Dallas Mavericks, Los Angeles Lakers, Miami Heat, NBA, New Orleans Hornets, Oklahoma City Thunder, Orlando Magic, Statistical Analysis

Team Expected Scoring – Final Regular Season Numbers

On Monday, we looked at the final regular season Expected Scoring numbers for individual players. Today we’re moving on, looking at those same numbers at the team level. You can find all the data at the Expected Scoring – Statistics and Analysis page, or at this link.

Expected Scoring is a way of combining a player or team’s shot selection and shooting percentages into one measure of scoring efficiency. Here’s the longer explanation:

Expected Scoring uses a player’s FGA from each area of the floor and multiplies it by the average number of points scored on that type of shot to come up with an Expected Point total from that area. The Expected Point total can than be compared to the actual number of points a player scored from that area to arrive at a Point Differential. This Point Differential is an expression of how a player shot compared to the league average, but I like that the comparison is drawn with actual point totals.  The average values of shots by location that I use (At Rim – 1.208, <10ft. – 0.856, 10-15ft. – 0.783, 16-23ft. – 0.801, 3PT – 1.081, FT – 0.759) were calculated by Albert Lyu of ThinkBlueCrew.

All of the individual Expected Scoring numbers are per 40 minutes. For the team stats we look at everything per game. By overall Point Differential, the top five shooting teams in the league were:

  • Miami: +5.72
  • Dallas: +5.27
  • San Antonio: +4.89
  • Phoenix: +4.37
  • Boston: +3.94

The bottom five were:

  • Cleveland: -4.28
  • Milwaukee: -3.71
  • Washington: -2.94
  • Charlotte: -2.74
  • Sacramento: -2.35

The New Jersey Nets didn’t make the bottom five, but joined the Bucks and Cavaliers as the only offenses with a negative Point Differential from every area of the floor. The Miami Heat were the only team with a positive Point Differential from every area of the floor.

Looking at these numbers, now for the second season, I’m amazed at how much of a difference excelling or struggling from just one area of the floor can make. The Toronto Raptors scored right around the expected rate from every area of the floor, except for on three-pointers, where they posted a Point Differential of -1.78. If they had shot just the league average on three-pointers it would have taken their Point Differential from a -0.83 to a +0.95.

The Clippers had the 6th best Point Differential on shots at the rim, +2.63. However, they were atrocious from everywhere else on the floor posting Point Differentials worse than -1.0 from the free throw line, on three-pointers, from 16-23ft. and from 3-9ft. If they had finished at the league average on shots at the rim, their overall Point Differential would have been -4.44. Basically they dunking of Blake Griffin and DeAndre Jordan kept the Clippers from having the worst shooting offense in the league.

Stay tuned for a few more Expected Scoring pieces between now and the end of the playoffs!

1 Comment

Filed under Atlanta Hawks, Boston Celtics, Charlotte Bobcats, Chicago Bulls, Cleveland Cavaliers, Dallas Mavericks, Denver Nuggets, Detroit Pistons, Golden State Warriors, Houston Rockets, Indiana Pacers, Los Angeles Clippers, Los Angeles Lakers, Memphis Grizzlies, Miami Heat, Milwaukee Bucks, Minnesota Timberwolves, NBA, New Jersey Nets, New Orleans Hornets, New York Knicks, Oklahoma City Thunder, Orlando Magic, Philadelphia 76ers, Phoenix Suns, Portland Trailblazers, Sacramento Kings, San Antonio Spurs, Statistical Analysis, Toronto Raptors, Utah Jazz, Washington Wizards

Last Night’s Numbers – 4/19/11

This is Last Night’s Numbers, a (mostly) daily feature where we run through the NBA games from the night before, highlighting one or two numbers I found particularly interesting from each game. All the stats are from Hoopdata’s box scores, which contain some additional advanced stats not available in traditional box scores.

Chicago 96 – Indiana 90

  • For the second straight game, Chicago destroyed the Pacers on the glass. The Bulls grabbed 63.3% of the available rebounds with an ORR of 45.5%. Carlos Boozer and Joakim Noah combined for 26 rebounds, 11 at the offensive end.
  • The Bulls’ rebounding edge helped overcome turning the ball over on 22.4% of their possessions. Derrick Rose turned the ball over 6 times in 40 minutes.
  • The Pacers shot 41.6% for the game, while holding the Bulls to 38.6%. However, the Pacers made just 12 of 24 shots at the rim.

Miami 94 – Philadelphia 73

  • The 76ers shot 34.2% for the game and made just 11 of 35 shots from inside of 10ft.
  • Chris Bosh scored 21 points on a 73.3 TS%. He also added 11 rebounds, 3 steals and an assist, all without turning the ball over in 35 minutes.
  • The 76ers perimeter players really struggled shooting the ball. Evan Turner was 6 of 10 from the field and made all 3 of his three-pointers. The rest of their guards shot 10 of 35, and were 3 of 11 on three-pointers.

Leave a comment

Filed under Chicago Bulls, Indiana Pacers, Last Night's Numbers, Miami Heat, NBA, Philadelphia 76ers, Statistical Analysis

Just Giving it Away

free gusto 3a

0.700

That number, 0.700, is the combined FTA/FGA ratio of Dwight Howard, Derrick Rose, Kevin Durant, Chris Paul, Dirk Nowitzki, LeBron James and Kobe Bryant after the first weekend of the NBA playoffs. It’s also patently absurd. It means for every 10 shots that septet attempted, they also attempted 7 free throws. Just for comparison, the FTA/FGA ratio across the entire league this season was 0.300. Those seven players had a combined FTA/FGA ratio of 0.448 during the regular season.

Let me point out that I’m talking about the ratio of free throw attempts to field goal attempts. Sites like Basketball-Reference, usually display a ratio of free throws made to field goal attempts. I’m primarily concerned here with the rate at which fouls are being called, so whether the free throw is made or missed is largely irrelevant for this discussion.

After the first game in each series, we have a FTA/FGA ratio of 0.368 for the playoffs, a significant increase over the 0.300 league-wide mark for the regular season. In recent history, this pattern has been common. The table below shows the FTA/FGA ratio for each of the past five seasons, comparing the regular season to the playoffs.

Other than 2007, we see that pattern of fairly significant increase in FTA/FGA from the regular season to the playoffs. This seems to fit well with the common wisdom, play is more physical in the playoffs, hence more fouls are called. Brief Digression: This pattern would also seem to fit with the idea that stars receive more calls in the playoffs. Which of course, runs counter to the perception that referees swallow their whistles in the postseason and let the players play. I can’t tell you how much I enjoy when several stereotypes are held without question, despite them being in complete opposition to each other

Given the ridiculous free throw numbers posted by that handful of players this weekend, it stands to reason that some of that difference between regular season and playoffs could be attributed to just a few souls. In trying to identify similar players for comparison, I noticed that the seven players I mentioned above could all be considered top candidates for Most Valuable Player. MVP candidates work well as a data set for this analysis because they generally post very high usage rates, and therefore would be taking a high number of both shots and free throws. Also, if we are going to talk about the idea that stars are given preferrential treatment, no one would seem to pull more gravity from their reputation than an MVP candidate from that season.

This next table shows the same information as above, except I removed from my calculations the free throw attempts and field goal attempts of the top seven MVP candidates for each season, from both the regular season and playoff figures. Essentially, this table just shows us the numbers for everyone besides those seven stars.

Except for 2007, we still see an increase from the regular season to the playoffs but it’s much less drastic without those seven stars included. In fact, in three of those seasons, the seven players I removed accounted for a tremendous portion of the overall difference. This last table shows the percentage of the difference between regular season and playoffs which can be traced to the performance of those seven players which were removed.

There are obviously great fluctuations from season to season. Part of that has to do with how deep each of the MVP candidates went in the playoffs. If a player participated in 5 playoff games his FTA/FGA ratio will have much less influence on these overall numbers than if they had played 25 games. If I went through each season subjectively selecting the “biggest stars” who’s teams went furthest in the playoffs, I’m sure I could come close to duplicating those 50% figures for every season.

Most of you probably won’t be reading this post until sometime on Tuesday. Statistics from Monday night’s games could change these numbers, but I would guess not enough to dilute my point. The bottom line here seems to be that stars get more calls in the playoffs, but we already knew that. This is attributable to a multitude of reasons, although probably not a malicious and diabolical system of collusion between the league and it’s officials. What seems especially striking here is how stars getting more calls in the playoffs diguises the real foul rate of everyone else. It’s true that there are more fouls called in the playoffs. However, it’s more true for some players than for others. One widely accepted truism obscures the real facts behind another.

4 Comments

Filed under Chicago Bulls, Dallas Mavericks, Los Angeles Lakers, Miami Heat, NBA, New Orleans Hornets, Oklahoma City Thunder, Orlando Magic, Statistical Analysis

Individual Expected Scoring – Final Regular Season Numbers

I’ve missed that narrow window between the end of the regular season and the beginning of the playoffs, but the final Expected Scoring numbers have arrived at long last. You can find them here, or by following the link through the Expected Scoring – Statistics and Analysis page.

If you’ve haven’t been following my Expected Scoring posts this season, then congratulations, you’re in the vast majority of basketball fans. Expected Scoring is a way of combining a player’s shot selection and shooting percentages into one measure of scoring efficiency. Here’s the longer explanation:

Expected Scoring uses a player’s FGA from each area of the floor and multiplies it by the average number of points scored on that type of shot to come up with an Expected Point total from that area. The Expected Point total can than be compared to the actual number of points a player scored from that area to arrive at a Point Differential. This Point Differential is an expression of how a player shot compared to the league average, but I like that the comparison is drawn with actual point totals.  The average values of shots by location that I use (At Rim – 1.208, <10ft. – 0.856, 10-15ft. – 0.783, 16-23ft. – 0.801, 3PT – 1.081, FT – 0.759) were calculated by Albert Lyu of ThinkBlueCrew.

There’s a lot to look at, so I thought I would just pull out a few highlights and lowlights.

Overall

For the second straight season, the overall Point Differential leader was Dirk Nowitzki (minimum 500 minutes played). Not only was he the most efficient scorer in the league, but he belongs to a small and elite group of players who posted a positive Point Differential from every area of the floor: Chris Paul, Daequan Cook, Pau Gasol, Ray Allen, Beno Udrih, Gary Neal, Steve Nash, Elton Brand and Nowitzki.

Rookies

This list really underscores how rare it is to find a rookie who plays within themselves, understands their strengths and weaknesses, and can provide efficient scoring right off the bat. 34 rookies played at least 500 minutes this season. Only these five, and Trevor Booker, of the Washington Wizards, posted a positive Point Differential across the entire season.

Most Improved:

Here are some players who saw big improvement in their point differential versus last season.

Young received a lot of attention this year for making himself into a somewhat efficient scorer. His transformation was based largely on a career high, and possibly unsustainable, field goal percentage on long two-pointers. Darrell Arthur and DeAndre Jordan seem like more likely candidates to repeat their levels of scoring efficiency next season.

Not So Hot

These are the guys who make you dig your fingernails into your palm everytime they even look at the rim.

There’s a ton of information here, and I’ve only done a cursory job of reviewing it. If you find something interesting that I’ve missed, feel free to share it in the comments! Final team Expected Scoring numbers should be up later this week.

2 Comments

Filed under Atlanta Hawks, Boston Celtics, Charlotte Bobcats, Chicago Bulls, Cleveland Cavaliers, Dallas Mavericks, Denver Nuggets, Detroit Pistons, Golden State Warriors, Houston Rockets, Indiana Pacers, Los Angeles Clippers, Los Angeles Lakers, Memphis Grizzlies, Miami Heat, Milwaukee Bucks, Minnesota Timberwolves, NBA, New Jersey Nets, New Orleans Hornets, New York Knicks, Oklahoma City Thunder, Orlando Magic, Philadelphia 76ers, Phoenix Suns, Portland Trailblazers, Sacramento Kings, San Antonio Spurs, Statistical Analysis, Toronto Raptors, Utah Jazz, Washington Wizards

Last Night’s Numbers – 4/18/11

This is Last Night’s Numbers, a (mostly) daily feature where we run through the NBA games from the night before, highlighting one or two numbers I found particularly interesting from each game. All the stats are from Hoopdata’s box scores, which contain some additional advanced stats not available in traditional box scores.

Saturday

Chicago 104 – Indiana 99

  • The Bulls completely controlled the glass, grabbing 59% of the available rebounds, with an ORR of 50%. Joakim Noah had 11 rebounds, 8 coming at the offensive end.
  • With a FTR of 0.390 the Bulls had a 15 point advantage at the free throw line. Derrick Rose made 19 of 21 at the line.
  • The Pacers made just 10 of their 23 shots at the rim. Tyler Hansbrough was 2 of 8.

Dallas 89 – Portland 81

  • With a FTR of 0.439, the Mavericks had a 16 point advantage at the free throw line. Dirk Nowitzki was 13 of 13.
  • The Mavericks made 10 of 19 three-pointers. Jason Kidd led the way, making 6 of 10. The Trailblazers made just 2 of 16.
  • Their three-point shooting and free throws helped compensate for the fact that the Mavs made just 7 of 23 shots from inside of 10ft.

Miami 97 – Philadelphia 89

  • With a FTR 0.527, the Heat had a 19 point advantage at the free throw line. LeBron James was 13 of 14 from the line.
  • The 76ers shot 41.2% for the game. They made just 14 of 50 shots from beyond 10ft.
  • Thaddeus Young had 20 points for the 76ers on a 46.0 TS%. He was 7 of 11 on shots at the rim, and just 2 of 9 from everywhere else. Young also added 11 rebounds, 8 of which came at the offensive end.

Atlanta 103 – Orlando 93

  • Dwight Howard scored 46 points on a 70.4 TS%. He added 19 rebounds, 6 offensive, but turned the ball over 8 times.
  • The Hawks Offensive Rating for the game was 112.0. However, they turned the ball over on just 10.9% of their possessions, and made 48.2% of the long two-pointers. Those may not be sustainable levels of performance across the rest of the series.
  • The Magic made 6 of 22 three-pointers. Jameer Nelson made 4 of 7, which means the rest of the team made 2 of 15.

Sunday

Memphis 101  – San Antonio 98

  • The Grizzlies interior tandem of Marc Gasol and Zach Randolph overwhelmed the Spurs. They combined for 49 points on 19 of 25 shooting with 23 rebounds.
  • The Spurs posted a FTR of 0.671, gaining a 15 point advantage at the free throw line. However, they shot only 40% from the field, and made just 10 of 30 shots from outside of 15ft.
  • Mike Conley had 10 assists for the Grizzlies, 7 of which went for layups or three-pointers.

New Orleans 109 – L.A. Lakers 100

  • Chris Paul carried the Hornets to victory. He scored 33 points on a 70.9 TS%. He also had 7 rebounds, 4 steals and 14 assists, 10 of which went for layups or three-pointers.
  • Kobe Bryant scored 34 points but on a 57.6 TS%. He added 5 assists and 4 rebounds but also turned the ball over 5 times.
  • Despite the Lakers huge size advantage, the Hornets were able to hold them to just 14 shot attempts at the rim. Andrew Bynum, Pau Gasol and Lamar Odom combined to score just 8 points at the rim.

Boston 87 – New York 85

  • Ray Allen scored 24 points for the Celtics, on a 73.5 TS%. He made 3 of 5 three-pointers, including the game winner with 11 seconds left.
  • Boston turned the ball over on 20.5% of their possessions, but compensated by controlling the glass. They grabbed 56.4% of the available rebounds with an ORR of 41.7%.
  • Carmelo Anthony and Amare Stoudemire each took 18 shots for the Knicks. Stoudemire made 12 of those 18 for 28 points. Anthony made 5 of those 18 for 15 points.

Oklahoma City 107 – Denver 103

  • Both teams turned the ball over on exactly 11.9% of their possessions. Shooting percentages were also very close, with Denver at 50.7%, Oklahoma city at 49.4%. The difference was the Thunder making 9 of 19 three-pointers, the Nuggets just 4 of 16.
  • Kevin Durant scored 41 points for the Thunder on a 71.7 TS%. He was 12 of 15 at the free throw line and added 9 rebounds.
  • The Nuggets did a great job scoring on the interior, making 21 of 24 at the rim. They were just 18 of 53 from everywhere else on the floor.

Leave a comment

Filed under Atlanta Hawks, Boston Celtics, Chicago Bulls, Dallas Mavericks, Denver Nuggets, Indiana Pacers, Last Night's Numbers, Los Angeles Lakers, Memphis Grizzlies, Miami Heat, NBA, New Orleans Hornets, New York Knicks, Oklahoma City Thunder, Orlando Magic, Philadelphia 76ers, Portland Trailblazers, San Antonio Spurs, Statistical Analysis

Last Night’s Numbers – 4/14/11

This is Last Night’s Numbers, a (mostly) daily feature where we run through the NBA games from the night before, highlighting one or two numbers I found particularly interesting from each game. All the stats are from Hoopdata’s box scores, which contain some additional advanced stats not available in traditional box scores.

Boston 112 – New York 102

  • The Celtics’ offense, minus their typical starters, exploded against the Knicks. They shot 56.5% from the field, and made 8 of their 17 three-pointers.
  • Avery Bradley scored 20 points in 27 minutes, on a 62.5 TS%. Bradley was 6 of 7 on shots at the rim.
  • The Knicks were 23 of 33 on shots at the rim, but just 10 of 38 on shots from beyond 15ft.

Chicago 97 – New Jersey 92

  • Joakim Noah had a double-double with 10 points and 10 rebounds in 23 minutes. 7 of his 10 rebounds came at the offensive end.
  • With a FTR of 0.342, the Chicago Bulls gave themselves an 8 point advantage at the free throw line.
  • Jordan Farmar scored 21 points on a 59.5 TS%. He also added 12 assists, 5 of which went for layups or three pointers.

Cleveland 100 – Washington 93

  • With a FTR of 0.349, the Cavs gave themselves a 14 point advantage at the free throw line. Ramon Sessions made 11 of 12.
  • Jordan Crawford finished his rookie season shooting 2 of 14. He missed all 11 of his shots that didn’t come at the rim.
  • J.J. Hickson had 13 rebounds, 6 of which came at the offensive end.

Dallas 121 – New Orleans 89

  • With a FTR of 0.466, the Mavericks gave themselves a 13 point advantage at the free throw line.
  • In just 20 minutes, J.J. Barea scored 14 points on a 77.1 TS%, with 8 assists. Barea was 7 of 7 at the free throw line, and 4 of his 8 assists went for layups or three-pointers.
  • Just 23 of the Hornets’ 79 field goal attempts came from inside of 10ft.

Golden State 110 – Portland 86

  • The two teams combined to make 21 of 49 three-pointers. Reggie Williams, Patrick Mills and Wesley Matthews each made 4.
  • Reggie Williams scored 28 points for the Warriors on a 77.8 TS%. 11 of his 12 made baskets were assisted on.
  • The Warriors made 26 of 37 shots at the rim, on their way to a 51.2% shooting performance on the night.

L.A. Clippers 110 – Memphis 103

  • Blake Griffin finished his rookie season with a triple-double. Griffin had 31 points on a 64.4 TS%, with 10 rebounds and 10 assists.
  • The Clippers made 26 of 29 shots at the rim. 47 of their 81 shot attempts came within 10ft. of the basket.
  • The Grizzlies turned the ball over on 20.8% of their possessions. O.J. Mayo had 5 in just 30 minutes.

Houston 121 – Minnesota 102

  • Chase Budinger exploded for 35 points on a 72.7 TS%. He made all 7 of his free throws, 4 of 8 three pointers, will contributing 6 rebounds, 4 assists and 2 steals.
  • Goran Dragic totalled a triple-double with 11 points, 11 rebounds and 11 assists. He put it together in exactly 44 minutes.
  • Anthony Randolph continued his string of strong performances to finish the season. Randolph had 23 points on a 65.9 TS%. He made 8 of his 9 shots at the rim.

Orlando 92 – Indiana 74

  • The Magic turned the ball over on 27.5% of their possessions . . . . and still beat the Pacers by 18. Earl Clark had 6 turnovers in 17 minutes.
  • The Pacers shot 30.7% for the game, making just 5 of 14 shots at the rim.
  • Brandon Rush scored 16 points for the Pacers, on 16 shots. He was 5 of 9 on three-pointers, 0 of 7 on two-pointers.

Detroit 104 – Philadelphia 100

  • With a FTR of 0.408, the Pistons gave themselves a 10 point advantage at the free throw line.
  • Rodney Stuckey finished the season with a strong performance. Stuckey scored 29 points on a 73.1 TS%. He made 10 of 11 free throws, and added 8 assists.
  • The 76ers made 21 of 25 shots at the rim and inexplicably missed all 10 of their shots in the 3-9ft. area.

Phoenix 106 – San Antonio 103

  • Marcin Gortat scored 21 points for the Suns, on a 60.6 TS%. Gortat also had 13 rebounds, 4 of which came at the offensive end.
  • The two teams combined for just 14 turnovers on 190 possessions. That’s a TOV% of 7.4%.
  • Steve Nash had 10 assists for the Suns, 7 of which went for layups or three-pointers.

L.A. Lakers 116 – Sacramento 108 (OT)

  • Kobe Bryant scored 36 points in 38 minutes. He did it on a 63.4 TS%, adding 9 rebounds and 6 assists.
  • Samuel Dalembert had 18 points and 18 rebounds for the Kings. 9 of his 18 rebounds came at the offensive end.
  • The Kings were 11 of 19 at the free throw line, giving the Lakers a 9 point advantage.

Milwaukee 110 – Oklahoma City 106

  • The Thunder, giving limited minutes to their normal rotation players, turned the ball over on 22.9% of their possessions.
  • The Bucks used 11 different players in the game, 7 of which scored in double-figures.
  • Michael Redd played 29 minutes for the Bucks, the most he’s played since January 8th, 2010. Redd scored 11 points on 5 of 10 from the field, knocking down 1 of his 3 three-pointers.

Utah 107 – Denver 103

  • Gordon Hayward had a career night for the Jazz. Hayward scored 34 points on an 88.5 TS%. He was 5 of 5 at the free throw line and made 5 of 6 three-pointers.
  • Both teams turned the ball over on exactly 16.8% of their possessions. They also posted identical FTRs, 0.338, and both made 39 of 77 from the field. The different was Utah’s 8 of 15 shooting on three pointers.

Miami 97 – Toronto 79

  • Toronto posted a FTR 0.531, but made only 22 of 34 at the line.
  • The Heat made 13 of 26 three-pointers. Eddie House and James Jones combined to make 11 of 19.
  • The Raptors shot 43.8% for the game. They were just 12 of 40 on shots that didn’t come at the rim.

Charlotte 96 – Atlanta 85

  • Charlotte turned the ball over on just 10% of their possessions, compared to 15.6% for the Hawks.
  • The Bobcats made 18 of 34 long two-pointers, an absurd 53.0%.

Leave a comment

Filed under Atlanta Hawks, Boston Celtics, Charlotte Bobcats, Chicago Bulls, Cleveland Cavaliers, Dallas Mavericks, Denver Nuggets, Detroit Pistons, Golden State Warriors, Houston Rockets, Indiana Pacers, Last Night's Numbers, Los Angeles Clippers, Los Angeles Lakers, Memphis Grizzlies, Miami Heat, Milwaukee Bucks, Minnesota Timberwolves, NBA, New Jersey Nets, New Orleans Hornets, New York Knicks, Oklahoma City Thunder, Orlando Magic, Philadelphia 76ers, Phoenix Suns, Portland Trailblazers, Sacramento Kings, San Antonio Spurs, Statistical Analysis, Toronto Raptors, Utah Jazz, Washington Wizards

NBA Anti-Awards: Final Edition

With the regular season now in our rear-view mirror, bloggers and basketball writers will be posting their choices for winners of the NBA’s postseason awards. Earlier this year, in a bout of malaise and general curmudgeonliness I created a handful of awards for some of the worst and most discouraging achievements of the season. The games have been played, the turnovers have been tabulated. It’s time for the NBA Anti-Awards to be handed out.

The Shawn Bradley Award – This award goes to the player 6’10″ or taller who has had the highest percentage of his shot attempts blocked (minimum 500 minutes played).

Bulls’ rookie, Omer Asik, led this category almost from start to finish. As the season wound down he was briefly overtaken by a late charge from the Hawks’ Zaza Pachulia. However, with Pachulia taking three shots without being blocked on the final night of the season, Asik passed him to win this award by the slimmest of magins. Pachulia finished with 19.0% of his shots blocked, Asik with 19.1%. Asik’s unique blend of size and general awkwardness should make him a contender in this category for years to come.

The Shawn Kemp Award – This award goes to the player who has fouled out of the most games. From 1986 up through the present, Shawn Kemp is the NBA’s leader in foul outs with 115, 35 more than his next closest competitor.

DeMarcus Cousins locked this one up, fouling out twice in his last eight games. Cousins finished the season with 10 disqualifications due to personal fouls. He put in a lot of work to make this award possible, committing 328 personal fouls on the season, 65 more than the next closest player. Cousins would like to thank his colleagues for all their wonderfully well-executed pump fakes.

The Jahidi White AwardThis award goes to the player with the lowest ratio of Ast/FGA (minimum 500 minutes played). The award is named for White who assisted on just 1.7% of his teammates’ baskets over a 334 game career.

Serge Ibaka is this year’s Jahidi White Award winner. Ibaka totalled 21 assists against 613 field goal attempts, for a ratio of 0.03. It’s tough to fault Ibaka. Playing alongside Kevin Durant and Russell Westbrook, a guy has to take any opportunity he can to get a shot up.

The Darrick Martin Award – This award goes to the player with the lowest FG% and a minimum of 300 attempts. The award is named for Darrick Martin, a career 38.2% shooter who played 514 games over 13 NBA seasons.

As I mentioned in previous updates there was a lot of movement in this category throughout the season, as players who shoot under 40% tend to find themselves outside the playing rotation. Pacers’ second-year point guard, A.J. Price, bucked the trend seeing progressively more playing time as his FG% plummeted. Price shot 35.7% on the season, narrowly edging cagy veteran Jason Kidd. Well done young fella’!

The Jason Kidd Award – This award goes to the player with the most turnovers in a single game. Jason Kidd has had a Hall of Fame career with many terrific positive statistical contributions. He’s also had 3 career games with more than 12 turnovers.

Amare Stoudemire‘s 11 turnover game against Washington, on December 10th, finished the season as the highest in the league. Derrick Rose made a late charge, posting games of 9 and 10 turnovers in February and March, but ultimately fell short. Rose will have to console himself with the NBA’s MVP award.

The Matt Bullard AwardThis award goes to the player 6’10″ or taller with the lowest Total Rebound Percentage. (Minimum 500 minutes)

This was one of our most competitive awards. At times Brook Lopez, Danilo Gallinari, Hedo Turkoglu and Andrea Bargnani all looked like clear favorites. In the end, dark horse candidate, Donte Green of the Sacramento Kings emerged as our winner. Greene, who stands 6 feet, 11 inches tall, grabbed just 7.4% of the total rebounds available while he was on the floor.

The Kobe Bryant AwardThis award goes to the player who has missed the most shot attempts in a single game. The award is inspired by Kobe’s performance in Game 7 of the Finals last season.

Surprisingly, this was our only category that finished with a tie. Kobe Bryant‘s 21 missed field goals, on November 11th against Denver, were matched just 16 days ago by Monta Ellis. Both players would probably rather throw this award away then put in on their mantles. I hope it doesn’t take them 21 tries to get it into the garbage can.

The Nick Anderson Award – This award goes to the player who missed the most free throws in a single game. Anderson was actually a decent free throw shooter. But his four missed free throw attempts in the 1995 Finals against Houston kind of stand out in my memory.

As expected Dwight Howard easily takes this award. This season he has missed 12 free throws in a game once, 11 free throws three times, and 10 free throws three times. Hopefully, taking home this hardware will lessen the sting of missing out on the MVP.

The Chris Childs AwardThis award goes to the player who has posted the highest Turnover Percentage so far this season. It’s named after former New York Knick Chris Childs, who retired with a career Turnover Percentage of 22.8%. (Minimum 500 minutes)

Joel Pryzbilla just barely topped our minutes requirement, stealing this award from Chris Duhon. Pryzbilla finished the season with a TO% of 34.2%. That means more than one out of every three Pryzbilla possessions ended with an offensive foul, a wild pass into the stands, or a dribble off his own leg.

The Andrea Bargnani Award (Formerly the Darius Songaila Award)– This award goes to the player who has provided his team with the least overall production. I use Wins Produced to determine the winner here. (Minimum 500 minutes)

Toronto’s Andrea Bargnani has been the favorite all season, and in the end, he did not disappoint. With a WP48 of -0.122 he’s “contributed” -6.0 wins in 2,353 minutes. As promised to several disgruntled Raptor fans, this award has now been renamed The Andrea Bargnani Award.

Congratulations to all the winners, it was a wonderful season of folly and futility!

8 Comments

Filed under Charlotte Bobcats, Chicago Bulls, Golden State Warriors, Indiana Pacers, Los Angeles Lakers, NBA, New York Knicks, Oklahoma City Thunder, Orlando Magic, Sacramento Kings, Statistical Analysis, Toronto Raptors

Last Night’s Numbers – 4/8/11

This is Last Night’s Numbers, a daily feature where we run through the NBA games from the night before, highlighting one or two numbers I found particularly interesting from each game. All the stats are from Hoopdata’s box scores, which contain some additional advanced stats not available in traditional box scores.

Chicago 97 – Boston 81

  • Boston shot 38.4% for the game. The especially struggled to score around the basket, making just 11 of 35 shots inside of 10ft.
  • Derrick Rose scored 30 points on a 73.5 TS%. Rose was a perfect 10 of 10 at the free throw line and handed out 8 assists with just 3 turnovers.
  • The Bulls grabbed 55.6% of the total rebounds, with an ORR of 25.0%. Carlos Boozer led the way 12 of their 44 rebounds.

Portland 98 – Utah 87

Leave a comment

Filed under Boston Celtics, Chicago Bulls, Last Night's Numbers, NBA, Portland Trailblazers, Statistical Analysis, Utah Jazz

The Most Important, Valuable, Irreplaceable, Memorable and Statistically Remarkable Player

Judge using his gavel

Debate over the naming of this season’s MVP has grown increasingly active and contentious over the past few weeks. Opinions have been flying in from every direction. Arguments have been made for Derrick Rose, against Derrick Rose, and for Dwight Howard. Even Kevin Love, Kyle Lowry and Russell Westbrook have had their names pop up. There have also been thousands of words written trying to clarify the boundaries of the debate. I’ve been working to codify my own opinion on the matter and, nearly there, I thought it was time to wade into the discussion. Luckily very few people actually read this site, so I won’t really be adding any fuel to the fire.

Judging by the media coverage, the MVP race seems to have been pared down to just two players; Derrick Rose and Dwight Howard. One of the main arguments from Rose’s supporters, against Howard, is that an end-of-game offensive liability shouldn’t be considered the league’s Most Valuable Player.

According to 82games.com, Rose has scored 43.2 points per 48 minutes in clutch situations (defined as the last five minutes of a game or during overtime, with neither team ahead by more than five points). That’s a gargantuan number, and one that dwarfs Howards’ 25.0. However, that number doesn’t cover efficiency in any respect. I took the numbers from 82games and did a quick conversion to points per possession (Pts/(FTA*0.4)+FGA+TO). The entire spreadsheet can be viewed here. By this measure of efficiency, the tables are completely turned. In clutch situations, Howard averages 1.37 points per possession, the 15th best mark among the 164 players 82games has statistics available for. Rose scores 0.87 points per possession in clutch situations, the 116th best mark.

Granted, Howard has accomplished this on a much smaller sample size, just 38 total possessions, by my calculations, compared to 126 for Rose. His efficieny would almost certainly decline with more clutch opportunities. Still, the numbers seem to indicate he could shoulder more of a load, and still be a reasonably efficient offensive option.  It seems that the Magic avoiding Howard in the clutch is as much about fear as it is about actual results.

Now, I’m about to make an argument that I don’t normally stand behind: These numbers I’ve presented don’t really matter to this discussion, and neither do any others. There is no consensus on the criteria which defines this award. Therefore, there is no way to offer definitive evidence in support of any candidate.

That’s not to say that the discussion isn’t worth having. In fact I think the ambiguity of criteria is precisely what makes this argument so interesting. The race for the league lead in PER hasn’t generated any attention, mostly because it doesn’t provide any room for subjective opinions. The PER leader is determined by a mathematical formula, with the weights for each statistical component pre-determined.

The fun of MVP discussions is that each person gets to create their own qualitative and/or quantitive evaluation method, assigning relative weight to, or ignoring completely, each piece of information. It’s a lot like disagreeing about which is best: New York style pizza or Kurt Vonnegut novels. That’s simply not an argument that can be won, but I’m sure it would lead to an interesting exchange of ideas.

I don’t have a problem with Rose winning MVP. I’m not entirely convinced he’s the best choice, but it’s certainly not a travesty if he wins. I do have a problem with the vocal minority who have been arguing it’s a travesty if he doesn’t win. There is a reasonable argument to be made for Rose. I think there is also a reasonable argument to be made for Dirk, LeBron and Howard.

Argue your belief, passionately and completely. However, acknowledge that someone else may do the same and reach a perfectly reasonable, albeit different conclusion from your own. Enjoy the discourse and exchange of ideas. There is no wrong answer in this discussion. Except of course for Kobe Bryant. That guy is terrible.

5 Comments

Filed under Chicago Bulls, Dallas Mavericks, Los Angeles Lakers, Miami Heat, NBA, Orlando Magic, Statistical Analysis